Despite a deluge of new information about the diversity and distribution of plants and animals around the globe, “big data” has yet to make a mark on conservation efforts to preserve the planet’s biodiversity. But that may soon change.
A new model developed by University of California, Berkeley, biologist Brent Mishler and his colleagues in Australia leverages this growing mass of data — much of it from newly digitized museum collections — to help pinpoint the best areas to set aside as preserves and to help biologists understand the evolutionary history of life on Earth.
The model takes into account not only the number of species throughout an area — the standard measure of biodiversity — but also the variation among species and their geographic rarity, or endemism.
“For most people, species are something special, but a plant like a dandelion, with lots of close relatives, shouldn’t be counted equal to our endemic redwood, which has no close relatives,” said Mishler, a UC Berkeley professor of integrative biology. “We now have a more complex view of biodiversity that takes into account more than the number of species, but also their rarity in the landscape and the rarity of close relatives.”
The model, which requires intense computer calculations, is described in Nature Communications.
“If our goal is to preserve the tree of life and pass it on to our children, then it’s important to preserve not only the cradles of new species, the neoendemics, but also the refuges of rare and threatened species, the paleoendemics; the nurseries and the nursing homes,” said Mishler, director of the University and Jepson Herbaria at UC Berkeley and senior fellow at the new Berkeley Institute for Data Sciences (BIDS).
Mishler and his colleagues created the model, which they call categorical analysis of neo- and paleoendemism (CANAPE), while he was in Australia in 2011 to take advantage of the country’s comprehensive plant database. Australia is ahead of the United States in terms of digitizing its museum collections and geographically coding, or georeferencing, them, he said.
Identifying California’s Preservation Needs
The model can be used, however, with any good georeferenced database of species abundance and relatedness, Mishler said. He, Bruce Baldwin and David Ackerly, UC Berkeley professors of integrative biology, earlier this year received a $391,000, three-year grant from the National Science Foundation to apply CANAPE to the state’s plant databases, primarily that of the Consortium of California Herbaria.
“These new methods will allow assessment of conservation reserve coverage and identify complementary areas of biodiversity that have unique evolutionary histories in need of conservation,” Mishler said.
Early results from California already have pinpointed regions — such as the upper Sacramento Valley near Lake Shasta, the coastal redwood belt and the San Francisco Bay Area’s unique serpentine soil areas — as hotbeds of endemic biodiversity worthy of preservation.
Use the Entire Tree of Life
Mishler’s model basically takes a yardstick to the limbs, branches and twigs of the tree of life, the branching diagram that illustrates the relationship of one species to another. The terminal “buds” of each twig are today’s living species, and the nearness of twigs represents how closely species are related.
The tree was initially a metaphor for the relatedness of all species. Charles Darwin referred to the tree of life in his seminal 1859 book, “On the Origin of Species.” But genetic comparisons and molecular dating have in the past several decades provided exact lengths, in years, for most of these branches, indicating how long ago a species had a common ancestor. That wealth of phylogenetic information has not yet been fully taken into account in assessments of biodiversity, Misher said.
“If we look only at the diversity of species — the twigs on the tree of life — we aren’t taking advantage of all this branch information,” he said. “It’s like looking at the frosting instead of the whole cake.”
The new method starts with the branches connecting the species in a specific area, so-called phylogenetic diversity, but then gives more weight to those branches that are endemic — that is, restricted in range. This “relative phylogenetic endemism” is a better measure of diversity and rarity, Mishler argues, and should be what scientists and policymakers look at when considering whether to conserve an area.
“This provides a powerful conservation argument as well as a method of identifying areas containing endangered lineages we need to protect,” he said. “Since we can’t save everything, we have to prioritize our conservation efforts, and this helps.”
Such an analysis can pinpoint and differentiate between areas with clusters of new, emerging species (neoendemics) and areas with clusters of unique, but disappearing, species (paleoendemics) that often occupy refuges such as high mountains.
“Our new method lets us spot not only concentrations of endemic lineages, but distinguish the long-lived paleoendemics and the short-lived neoendemics,” Mishler said.
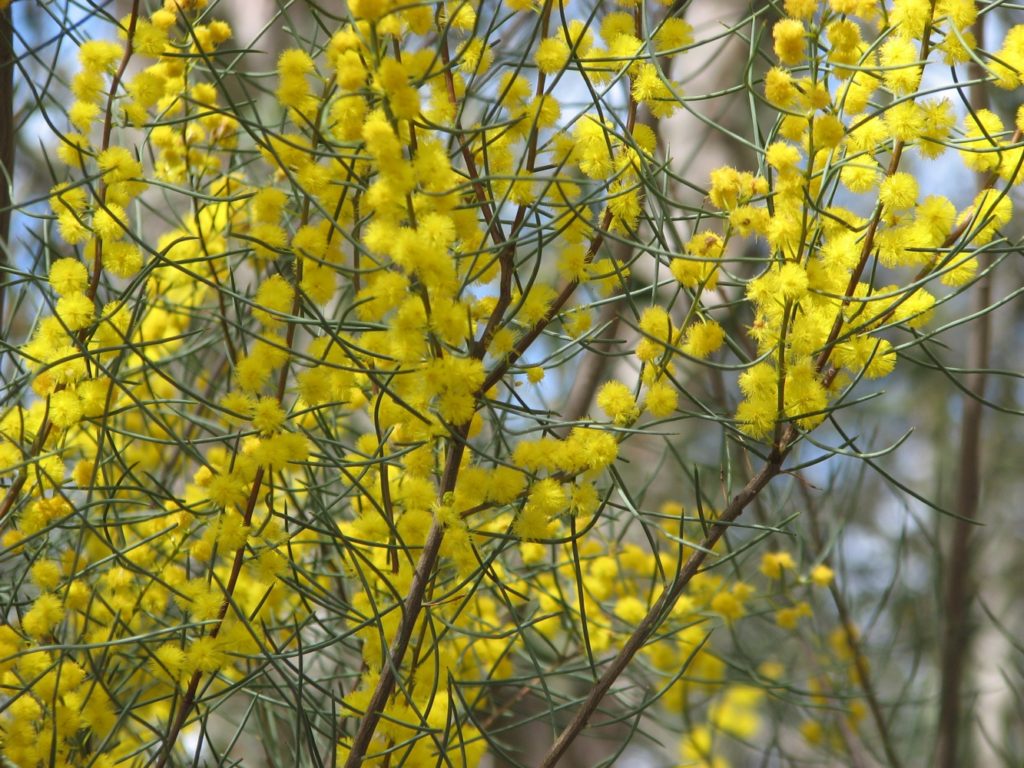
The new paper takes as an example a small subset of Australia’s flora, its acacia trees. Mishler and coauthors show how one can lay a grid across the entire continent and count not only the species (twigs) in each area, but also the phylogenetic distance between species (the branch length between twigs), measuring down the branch to the nearest junction, then back up to the other twig. Diversity weighted by a branch’s endemism yields a unique map of areas of endemism.
The scientists’ analysis identified three areas — the rainforests of southwest Western Australia, the Gascoyne region and Tasmania — where conservation efforts might preserve rare endemic species.
According to Mishler, the model could someday establish definitively which regions of the world, such as California or Australia, are the most diverse.
Are you the author of this article? We had a site crash back in 2016 and lost some author attributions. We promise this is not a snub! Please email us and let us know that this is your post. Thanks and apologies!


