
Methane is a small molecule composed of one carbon and four hydrogen atoms. It’s emitted as a gas naturally from wetlands and petroleum seeps, and from human activities like farming and burning fossil fuels. Once methane enters the atmosphere, it efficiently absorbs infrared radiation from the sun, trapping heat energy that would otherwise be lost into space. Methane in the atmosphere is destroyed when it reacts with different chemicals like oxygen, in a process called oxidation.
Scientists want to know how much methane is in the atmosphere, since it contributes to the overall carbon budget on Earth today. They can compare the amount of methane entering the atmosphere every year, or the flux, to the amount of methane destroyed through oxidation. They use these values to calculate how much global warming methane can cause over time. Scientists using this method calculated 18 teragrams (Tg) of extra methane per year in the atmosphere. But they found data on methane fluxes varied depending on how they were measured, especially in wetland areas.
Recently, a team of scientists led by Xueying Yu from the University of Minnesota sought to build more certainty into these methane flux estimates. They aimed to calculate net methane emissions around the globe, by measuring both the fluxes of methane and the molecules that destroy methane, or its sinks. They used data from a satellite-based system called the TROPOspheric Monitoring Instrument, or TROPOMI, to quantify how much methane is entering the atmosphere. They used data from other sources, like the Atmospheric Tomography (ATom) airborne campaign, to quantify the main molecules that destroy methane, called hydroxyls.
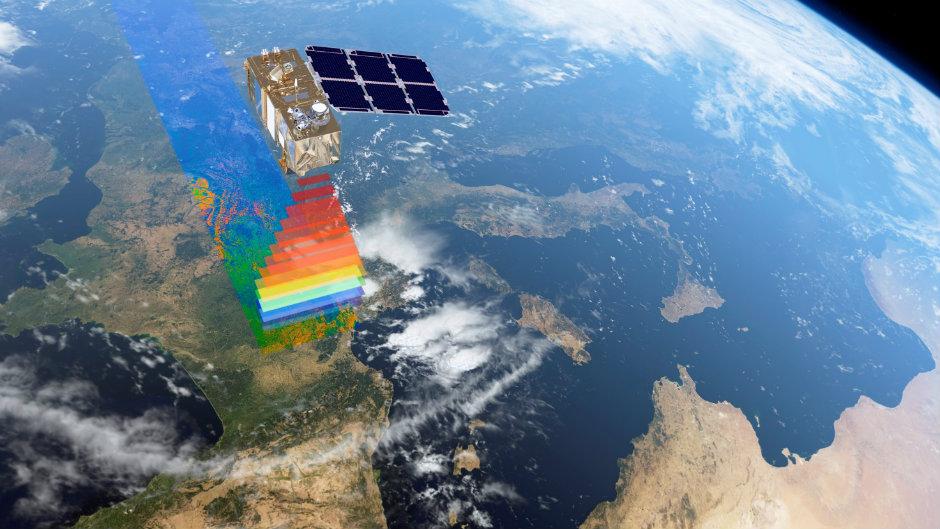
The TROPOMI detectors, onboard the Copernicus Sentinel-5 satellite, use infrared light to measure the amount of methane in the atmosphere. The European Space Agency deployed this satellite in 2017 with gas detectors that continuously measure methane over tens of kilometers. Scientists can also correct for potential problems with the infrared light detection, such as clouds, aerosols, or difficult viewing angles, to ensure the final data from these detectors are valid.
Yu and the team compiled methane concentration data taken from January, 2018, to February, 2020. In total, the researchers processed 91 million data points over two years to cover the globe. They processed the data through mathematical models to check for data quality, and created methane flux estimates at the scale of 1 km2 (about 0.4 square miles).
They estimated global methane emissions during the study period were 587 Tg per year. They found 571 Tg of methane per year was destroyed by hydroxyls during that same time, meaning 16 Tg of methane per year remained in the atmosphere. Imagine 4 million Goodyear blimps full of methane floating over the planet!
Because the team used satellite data with high spatial resolution, they could also pinpoint specific methane sources around the globe. They found the most methane was coming from livestock (132 Tg per year), fossil fuel sources (98 Tg per year), waste treatment (83 Tg per year), and rice cultivation (42 Tg per year). They explained man-made processes like petroleum production in the Middle East and parts of Asia emitted more methane than they expected, while Russia emitted less methane than they expected.
The researchers also compared methane emissions with weather trends like changes in rainfall and seasonal monsoons during the two-year-long study. As a result, they found areas with higher rainfall had higher net methane emissions. For example, they found higher methane emissions in India from June to September during monsoon season. The authors attributed the monsoonal methane increase to expansion of water-saturated habitats, which other researchers have shown are an important methane source. Similarly, the regions of Amazonia and Northern Brazil in South America emitted 51 Tg of methane per year, which the researchers tied to increased flooding. They found more methane was also emitted in central Africa, where wetlands have expanded because of heavier rainfall.
The authors concluded that understanding both the sources and sinks of methane in the atmosphere is key to creating accurate global methane budgets and predicting future global warming. They interpreted their new, satellite-based measurements to show that more methane is entering the atmosphere than can be destroyed by natural processes. However, they cautioned their study was too limited to accurately assess all the methane sinks in the atmosphere. They intend to incorporate additional datasets on these sinks to better quantify net methane emissions in the future.
